Compare Performance chart
Use the Compare Performance Chart on the Explore Performance page for scorecard performance comparison analysis between multiple employees or organizations (50 maximum) and a single KPI
This workspace Area within an application window where the user interacts with the program. displays in the right pane of the Performance widget Visual building block in an application that is interchangeable, depending on system or user configurations. with the associated data. The color of each bar is the score of the employee or organization from lowest to highest value. You must have the applicable privileges to view the score and goal for employees or organizations.
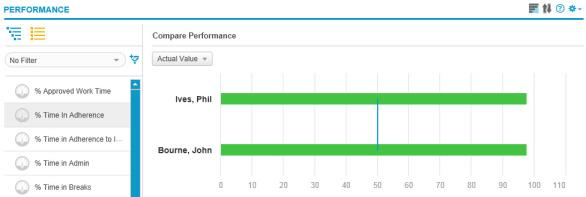
If a KPI is selected, it is possible to select Actual Value or Peer Value.
Point to a bar to view a tooltip with the employee name, actual value/peer value, goal, score, and description. Click the bar to drill down to the KPI View for the employee or organization.
Compare Performance workspace controls